10.6 Quality
10.6.1 Statistical Assessment – Summary
The following methods of representation
provide support for the adequate analysis of data from production
and for problem-solving:
Classifications
To distinguish partial problems according to their
importance, errors logged by priority can be displayed using
tally charts or histograms (Pareto diagrams/ABC analysis).
Relationships
Listing possible causes of errors and organising
them with respect to the influence of man, method, machine
and material in order to determine their reasons and effects
is generally represented on a herring-bone diagram (Ishikawa).
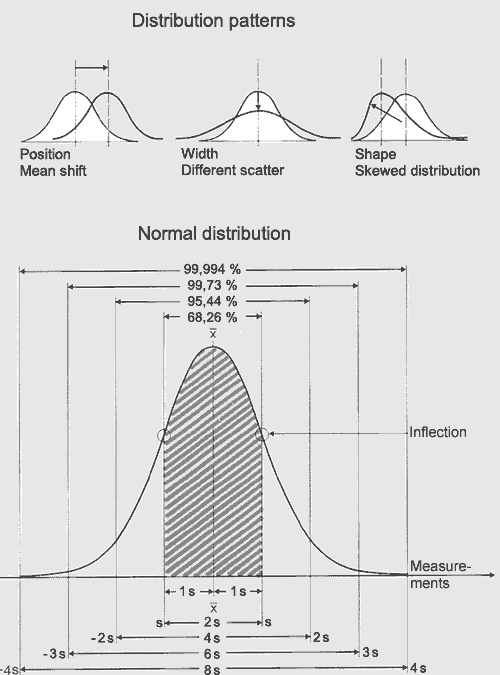
Distributions
The conversion of series of measurements into distribution
functions and their characteristic values (median x, variance
?) describe an operation and allow subsequent measurements
to be predicted (histogram).
Control cards
The graphical representation of measurement data
with respect to time along with the corresponding boundary
values provides assistance to the decisions required for process
control.
Scatter plots
The representation of individual values related by
two influencing factors leads to a description of their relationships.
Diagram types
When analysing data, a clear graphical representation
is helpful. In general, line plots, histograms and pie charts
are used.
Test forms
These serve to represent the results of routine tests in tabular
form.

Figure 232: Shapes of distributions and normal
distribution.
|

